
How to use MER without letting one blended number hide cohort decay, channel lag, discount pressure, and attribution noise.
Ranjeet Ranjan
AI Executive Brief
Marketing Efficiency Ratio (MER) is a widely used metric to gauge marketing spend effectiveness, but it has significant limitations when used alone in dynamic D2C businesses. This article explains those limitations, offers frameworks and complementary metrics such as cohort analysis and multi-touch attribution, and guides marketers to smarter, data-driven decisions for sustainable growth.
D2C teams often use MER as if one blended efficiency number can explain growth quality, channel causality, and budget safety. That creates a measurement problem: MER can improve while new-customer quality weakens, repeat customers carry revenue, discounts compress margin, or paid media harvests demand that already existed.
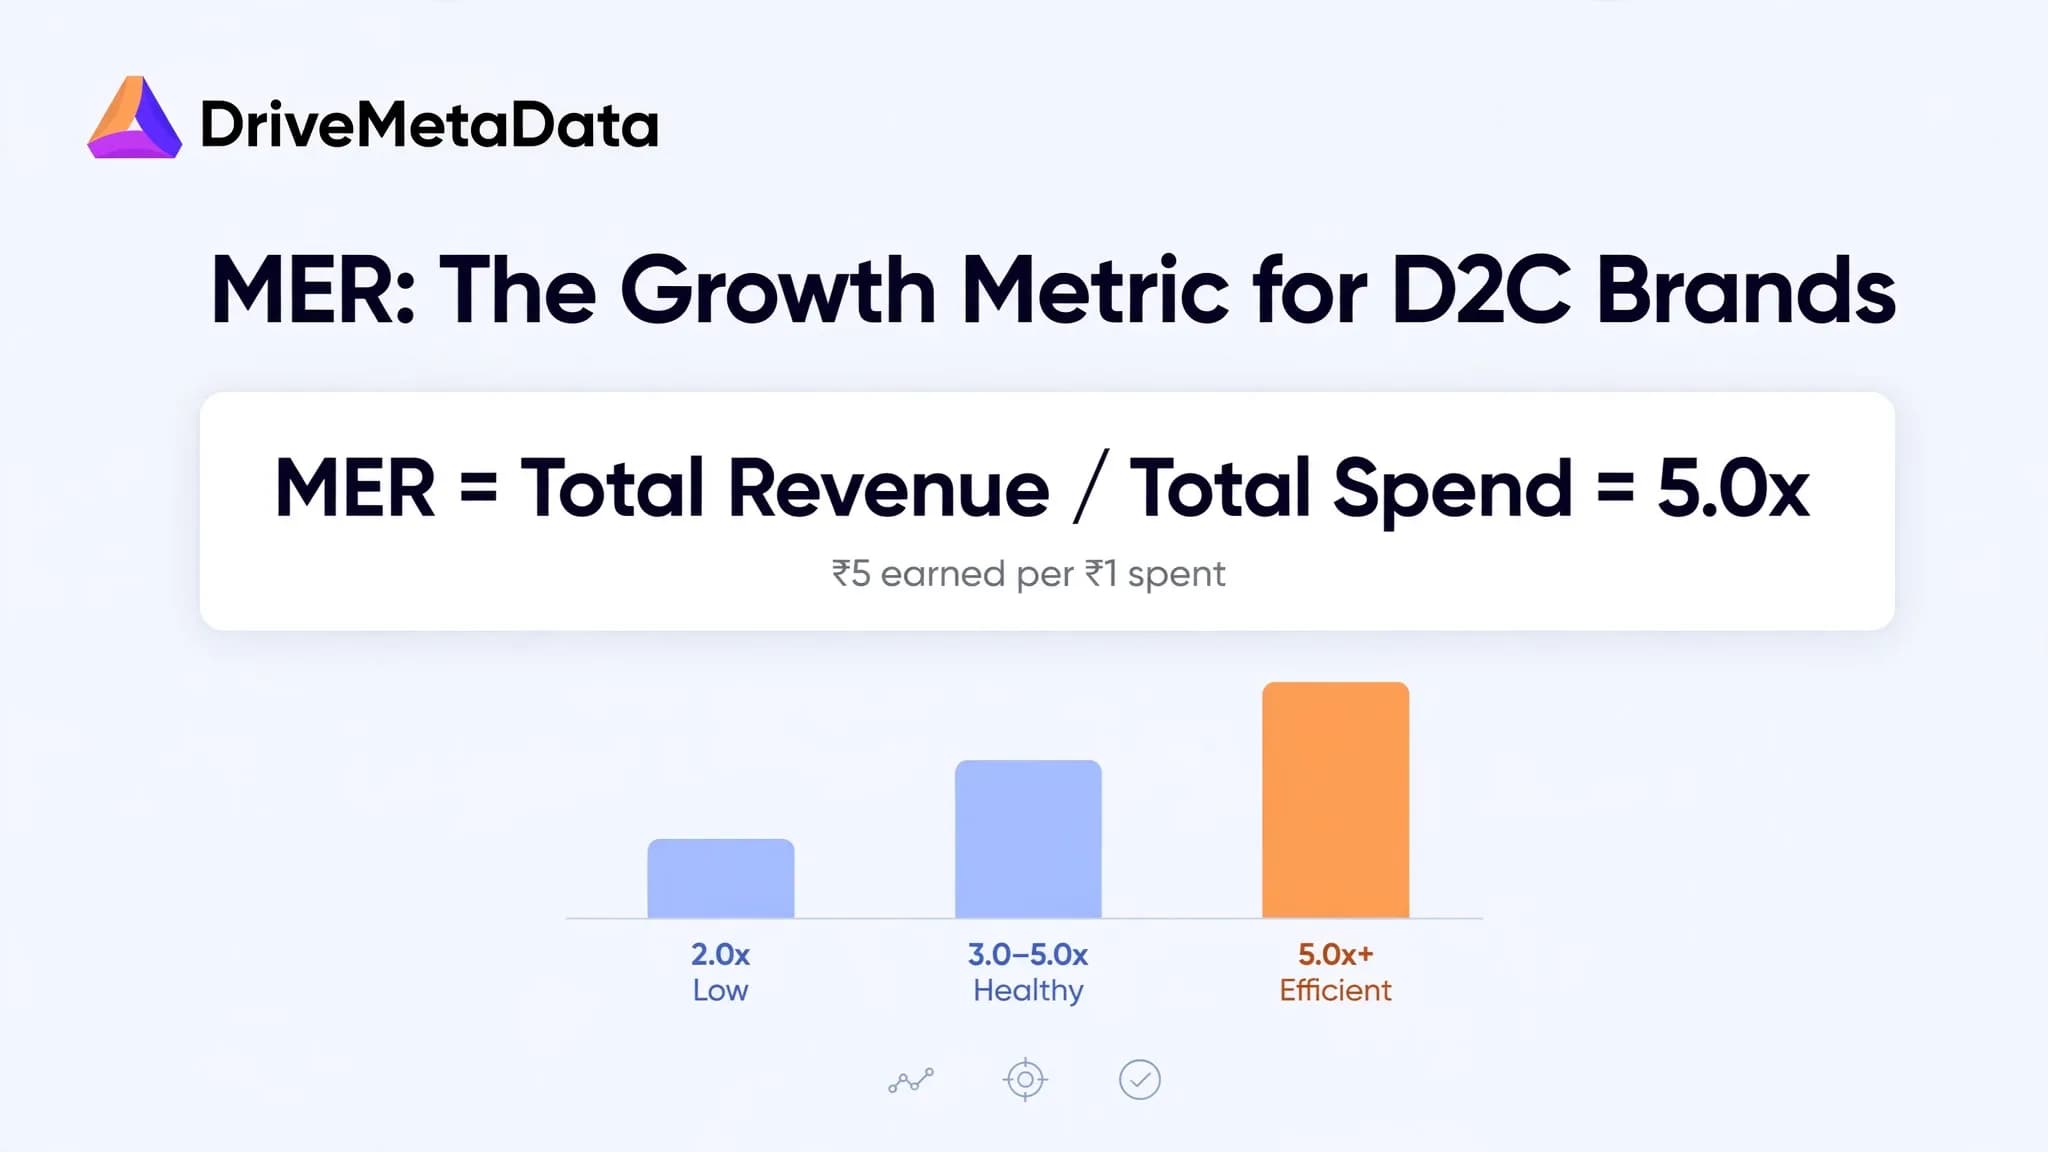
Marketing efficiency ratio (MER) compares total revenue with total marketing spend. It is useful as a board-level efficiency signal for D2C brands, but it should not make budget decisions alone. Pair MER with cohort retention, LTV:CAC, channel attribution, margin, and incrementality checks before scaling, cutting, or shifting spend.
That is why MER is attractive: it gives founders, CMOs, and finance teams one clean number. If total revenue rises faster than marketing spend, the business looks more efficient. If the number falls, the team knows something needs attention. That clarity is useful. It is also dangerous.
A D2C brand can improve MER while acquiring worse customers. MER can rise because returning customers did the work, because promotions pulled demand forward, because inventory constraints reduced spend, or because paid media harvested buyers who were already going to purchase. A blended efficiency ratio can look like proof of healthy growth when it is really a warning light with the label removed.
The job is not to abandon MER. The job is to put a warning label on it.
Evidence Snapshot: Why MER Needs Context
| Source | Public data or official guidance | What it supports | Caveat |
|---|---|---|---|
| Google Analytics Help: Get started with attribution | Google describes data-driven attribution as assigning key-event credit based on account data and evaluating converting and non-converting paths. | Channel credit is model-dependent, so a single blended efficiency number should be checked against attribution context. | Google guidance is platform-specific and does not prove any D2C outcome by itself. |
| Google Ads Help: About data-driven attribution | Google Ads says data-driven attribution helps identify which keywords, ads, ad groups, and campaigns contribute to business goals. | Campaign-level decisions need more detail than aggregate revenue divided by aggregate spend. | Useful for Google Ads measurement, but it does not replace margin, cohort, or finance validation. |
| Shopify Help Center: Customers reports | Shopify's customer cohort report groups customers by first-order date and reports acquisition and retention data. | D2C teams can use cohort behavior to test whether MER reflects durable customer quality or short-term revenue. | Store reporting depends on clean customer and order data. |
| IAB State of Data 2024 | IAB describes privacy changes and signal loss as forces that have altered addressability, measurement, and digital advertising. | Measurement reliability should be treated as a constraint, not an assumption. | Industry research is broad and should be paired with company-specific data. |
| Apple Support: App Tracking Transparency | Apple states that apps must ask permission before tracking user activity across other companies' apps and websites for advertising or sharing with data brokers. | Platform privacy rules can limit direct tracking signals used in marketing measurement. | Applies to Apple app environments and should not be overgeneralized to every channel. |
What MER Measures
Marketing efficiency ratio means total revenue divided by total marketing spend for a defined period.
MER is a blended business efficiency metric. It asks, "How much revenue did the business generate for each dollar of marketing spend?" D2C teams use MER because it connects media spend to revenue without relying only on platform-attributed conversions. The weakness is that MER does not explain which customers, channels, or behaviors created the revenue.
Formula: MER = Total revenue / Total marketing spend. For example, $500,000 total revenue divided by $100,000 marketing spend equals a 5.0 MER. That does not mean every marketing dollar created five dollars of incremental revenue. It means the business produced five dollars of revenue for every dollar recorded as marketing spend in that measurement window.
What MER Cannot Prove
MER cannot tell you whether a channel caused the revenue, whether new customers are healthy, whether repeat buyers are carrying the period, whether discounts hurt margin, or whether the spend would have converted anyway through email, organic search, direct traffic, or brand demand.
MER should be treated as a directional efficiency signal, not a final budget answer. A rising MER can be good when retention, margin, new-customer quality, and contribution profit also improve. A rising MER can be misleading when revenue comes from existing customers, heavy discounts, delayed attribution, undercounted spend, or channels that capture demand rather than create it.
The TRUST MER Framework
Use the TRUST MER Framework before making a budget decision from blended MER.
| TRUST check | Question to ask | Data to inspect | If the answer is weak |
|---|---|---|---|
| T - Timing alignment | Do spend and revenue belong to the same decision window? | Spend dates, order dates, attribution windows, refund timing, delayed conversions | Recalculate MER by decision period and note lag-sensitive channels. |
| R - Repeat revenue context | Is MER improving because existing customers are buying again? | New vs returning revenue, acquisition cohorts, repeat purchase rate, email/SMS ownership | Split MER into new-customer MER and returning-customer revenue contribution. |
| U - Unit economics | Does efficiency survive margin, discounts, returns, and shipping cost? | Gross margin, discount rate, return/refund rate, contribution profit, payback period | Use contribution MER or margin-adjusted payback before scaling. |
| S - Source-system integrity | Are Shopify, ad platforms, analytics, CRM, and finance telling the same story? | Shopify orders, platform spend, GA4 events, CRM profiles, finance revenue | Reconcile definitions before presenting MER as a trusted number. |
| T - Touchpoint evidence | Does channel credit match customer behavior and incrementality evidence? | Attribution paths, assisted conversions, holdout tests, channel sequence, promo exposure | Treat MER as a prompt for attribution or incrementality analysis, not a decision endpoint. |
Run TRUST in order. First verify the accounting window, because wrong timing contaminates every other conclusion. Then separate customer type, unit economics, source-system quality, and touchpoint evidence. A D2C team can trust MER more when all five checks point in the same direction. If any check fails, MER should trigger deeper analysis before a budget move.
The MER Warning Label Checklist
| Warning label | Symptom in the dashboard | What it may mean | Next action |
|---|---|---|---|
| Blended number | MER improves while new-customer volume weakens | Returning customers or existing demand may be carrying revenue | Compare new-customer MER with returning-customer revenue. |
| Promotion distortion | MER rises during a discount-heavy period | Discounting may be pulling revenue forward or hurting margin | Add discount rate, contribution margin, and repeat purchase by promo cohort. |
| Channel mix shift | MER changes after budget moves between paid search, paid social, affiliates, and email | The ratio may reflect channel timing, not true efficiency | Review channel sequence, attribution paths, and assisted conversion patterns. |
| Cohort decay | First orders look strong but later purchases weaken | Acquisition quality may be falling | Compare cohorts by acquisition month, first order source, repeat purchase, and LTV:CAC. |
| Signal gap | Platform reports, analytics, and finance disagree | Tracking, identity, or data reconciliation may be unreliable | Run a source-system reconciliation before using MER in planning. |
| Incrementality risk | Paid media receives credit for buyers who were already active | Spend may be harvesting demand | Use holdout tests, geo tests, or incrementality reads where practical. |
Use MER to pace the business when customer mix, channel mix, margins, and source systems are stable. Use MER as an investigation trigger when any of those conditions change. The more dynamic the D2C business, the less MER should act alone.
When MER Is Reliable Enough To Guide A Decision
MER can be useful for weekly or monthly pacing when the business is operating in a stable environment. It is more reliable when channel mix is stable, promotions are normal for the period, new-customer and returning-customer revenue are tracked separately, gross margin and return rates are not moving against revenue, and ad platform spend, Shopify revenue, analytics events, CRM profiles, and finance reporting are reconciled.
In that situation, MER can help a founder or CMO answer a practical question: "Are we spending at a level the business can currently support?" MER is especially useful in executive conversations because it avoids a common platform-reporting trap. Platform ROAS asks how much attributed revenue a platform reports against its own spend. MER asks whether the whole business is converting marketing spend into revenue.
For channel-specific decisions, teams should combine MER with marketing attribution, cohort quality, and margin context.
When MER Should Trigger Deeper Analysis
- MER rises while contribution profit is flat.
- MER rises while new-customer acquisition slows.
- MER rises during a promotion-heavy period.
- MER falls after a brand, creator, or upper-funnel campaign that may convert later.
- MER falls while cohort retention, LTV:CAC, or customer quality improves.
- Platform ROAS and business revenue move in different directions.
- Finance, Shopify, GA4, CRM, and ad platforms do not reconcile.
A budget should not move because MER changed. A budget should move because MER changed and the supporting diagnostics explain why. The right action might be scale, hold, suppress, retarget, reactivate, fix tracking, or redesign the offer. MER alone cannot choose between those actions.
This is where D2C teams often need the same discipline they use in Shopify CAC by cohort: evaluate the customers created by spend, not only the revenue recorded during the spend period.
Illustrative Scenario: The Campaign Looks Efficient, But Cohorts Say Wait
Consider an illustrative D2C apparel brand. The leadership team sees MER improve for two reporting periods. The performance team wants to scale the paid social campaign that appears to be driving the lift.
The first warning label appears when analytics separates new and returning customers. Returning-customer revenue increased faster than new-customer revenue. The second warning label appears when the team reviews discount exposure. Many first orders came through a limited-time offer. The third warning label appears when the cohort view shows weak early repeat behavior for customers acquired during the promo period.
- Keep the campaign running at a controlled spend level.
- Build a cohort view by acquisition month, first-order source, discount exposure, margin, and repeat purchase.
- Compare platform-attributed performance against attribution paths and incrementality evidence.
The result to measure is not "did MER stay high next week?" The result to measure is whether paid-acquired customers repeat without discount pressure, whether LTV:CAC improves, whether contribution margin supports payback, and whether channel credit still holds after attribution review. This is not a customer case study or benchmark. It is an operating scenario.
Metrics & Evidence
| Metric | Formula / how to calculate | Source type | Freshness needed | What it proves | Caveat | Action trigger |
|---|---|---|---|---|---|---|
| MER | Total revenue / total marketing spend | Finance revenue plus paid, owned, and partner marketing spend | Weekly for pacing; monthly for planning | Shows blended business efficiency | Does not prove channel causality or customer quality | Investigate when MER moves without a clear business explanation. |
| New-customer MER | New-customer revenue / marketing spend tied to acquisition period | Shopify or ecommerce orders, CRM customer status, finance spend | Weekly or monthly | Separates acquisition efficiency from existing-customer demand | Requires clean new vs returning customer logic | Use when returning-customer revenue may be lifting blended MER. |
| LTV:CAC | Customer lifetime value / customer acquisition cost | Cohort revenue, margin assumptions, acquisition spend | Monthly cohorts; refreshed as retention matures | Tests whether acquired customers can support acquisition cost | Early cohorts are incomplete and should be caveated | Hold or revise spend when acquisition volume grows but LTV:CAC weakens. |
| Contribution MER | Contribution revenue or gross profit / marketing spend | Finance margin, discounts, returns, shipping, marketing spend | Monthly or after major promotions | Shows whether efficiency survives unit economics | Requires finance-approved cost definitions | Review discounting and channel mix when revenue MER improves but contribution MER does not. |
| Cohort retention | Customers from cohort active after period / total cohort size | Shopify cohort reporting, CRM, subscription or transaction data | Monthly by acquisition cohort | Reveals whether acquired customers continue buying | Lagging metric; immature cohorts need caution | Investigate when high-MER periods create weak repeat behavior. |
| Incrementality read | Incremental conversions or revenue from test group minus control or holdout | Platform lift tests, geo tests, matched-market tests, experiment logs | Per campaign test cycle | Estimates whether spend caused additional demand | Needs test design discipline and enough volume | Use when paid media may be harvesting existing demand. |
| Attribution path quality | Assisted conversions, path position, conversion lag, channel sequence | GA4, ad platform reporting, warehouse attribution, CDP events | Weekly for active campaigns; monthly for planning | Shows how channels interact before purchase | Model outputs vary by data quality and model choice | Review before cutting channels that influence later conversion. |
How To Interpret MER With Attribution, MMM, And Incrementality
MER, attribution, MMM, and incrementality answer different questions. MER asks whether marketing spend is efficient at the business level. Attribution asks which touchpoints receive credit under a defined model. Marketing mix modeling asks how spend, seasonality, pricing, channel mix, and external factors relate to outcomes over time. Incrementality asks what happened because the marketing ran.
MER is the fastest executive signal, attribution is the most useful journey diagnostic, MMM is better for broad budget allocation patterns, and incrementality is the strongest causal check when a test can be designed well. D2C teams should not force one method to answer every question. For a deeper comparison, use the distinction between attribution, MMM, and incrementality before deciding which evidence belongs in the next budget review.
Common Mistakes When D2C Teams Use MER
Mistake 1: Treating MER As A Channel Scorecard
MER is blended. It cannot tell you which campaign, audience, creator, email flow, or channel created revenue. Use MER to detect a business-level change. Use attribution, cohort analysis, platform experiments, and finance reconciliation to decide what caused the change.
Mistake 2: Ignoring Customer Mix
A blended MER can improve when returning customers buy more, even if paid acquisition quality is getting worse. Every MER review should separate new-customer revenue, returning-customer revenue, and reactivated-customer revenue. If source systems cannot make that split, customer identity quality is part of the measurement problem. That is the kind of data issue behind customer identity bankruptcy.
Mistake 3: Forgetting Margin
Revenue MER can look healthy while contribution economics deteriorate. Discounts, returns, shipping subsidies, payment fees, and fulfillment costs can all change the real quality of revenue. Finance should define the contribution logic before marketing turns MER into a scale signal.
Mistake 4: Letting Platform ROAS Win The Argument
Platform ROAS and MER can both be true while pointing to different decisions. A platform can report attributed revenue under its own model while the business sees weaker blended efficiency, weaker margins, or poor repeat behavior. Reconcile platform reporting with business revenue and customer quality before changing spend. Teams that are evaluating tools should make this a requirement when choosing marketing attribution software.
Mistake 5: Using AI Forecasts On Untrusted Inputs
Predictive models can help forecast demand, payback, and customer value, but only when the inputs are governed. If identity, spend, revenue, and cohort labels are wrong, an AI model can optimize the wrong objective with impressive consistency. Clean the signal before automating the spend decision.
How DriveMetaData Fits
DriveMetaData should not replace MER. It should make MER more trustworthy.
For D2C teams, the practical fit is connecting customer, campaign, transaction, attribution, and activation data so a blended efficiency number can be explained by source system, customer type, cohort, channel path, and action. That matters when founders, CMOs, finance leaders, and performance teams need the same answer before a budget move.
DriveMetaData supports this by helping teams unify customer identities, reconcile campaign and revenue data, detect measurement gaps, evaluate attribution paths, and activate cleaner segments for lifecycle and paid media decisions. The business value is not another dashboard. The business value is knowing whether MER means "scale," "hold," "fix," "suppress," "retarget," or "investigate."
FAQ
What is a good MER for D2C?
There is no universal good MER because business model, margin, category, repeat purchase rate, price point, discounting, and growth stage all change the answer. A useful MER target should be set from your own contribution margin, payback tolerance, retention curve, and cash needs. Treat public benchmarks as context, not a budget rule.
Is MER better than ROAS?
MER is broader than ROAS, but it is not automatically better. ROAS compares attributed revenue with ad spend, usually at the campaign or platform level. MER compares total revenue with total marketing spend at the business level. Use MER for executive efficiency and ROAS for channel diagnostics, then reconcile both with finance and cohort data.
Why can MER improve while growth quality gets worse?
MER can improve when returning customers, promotions, price changes, delayed conversions, organic demand, or attribution gaps lift revenue without proving durable acquisition. If new paid cohorts have weak repeat purchase behavior or poor contribution margin, a better blended MER may still hide weaker growth quality.
How often should a D2C team review MER?
Review MER weekly for pacing and monthly for planning. Weekly reviews should avoid overreacting to timing noise. Monthly reviews should include cohort retention, new vs returning revenue, gross margin, CAC, LTV:CAC, attribution context, and any major promotions or inventory constraints.
Should MER be included in a board report?
Yes, but it should not be the only marketing metric in a board report. Pair MER with contribution margin, new-customer acquisition, cohort retention, payback, attribution context, and a short note explaining what changed. A board should see both the efficiency signal and the evidence behind it.
MER remains useful when it is treated as a business-level efficiency signal, not a complete explanation of growth. D2C teams should use MER to spot changes, then validate those changes with cohorts, contribution economics, attribution paths, source-system reconciliation, and incrementality evidence. The strongest budget decisions come from asking what the MER movement means before deciding whether to scale, hold, fix, suppress, retarget, or investigate.
Attribution Audit
Find the gaps hiding in your attribution data.
Get a focused audit of campaign tracking, ROAS signals, and conversion paths before media spend leaks into blind spots.
Related Blogs
More from our insights
Shopify Customer Journey Attribution: Multi-Touch Models & Repeat Order Tracking
Customer Data Platform · 6 min read
Returns-Adjusted ROAS: Formula, Calculation & How to Measure True Ecommerce Profitability
Customer Data Platform · 11 min read
Select Marketing Attribution Software for Accurate ROAS Tracking
Customer Data Platform · 6 min read