
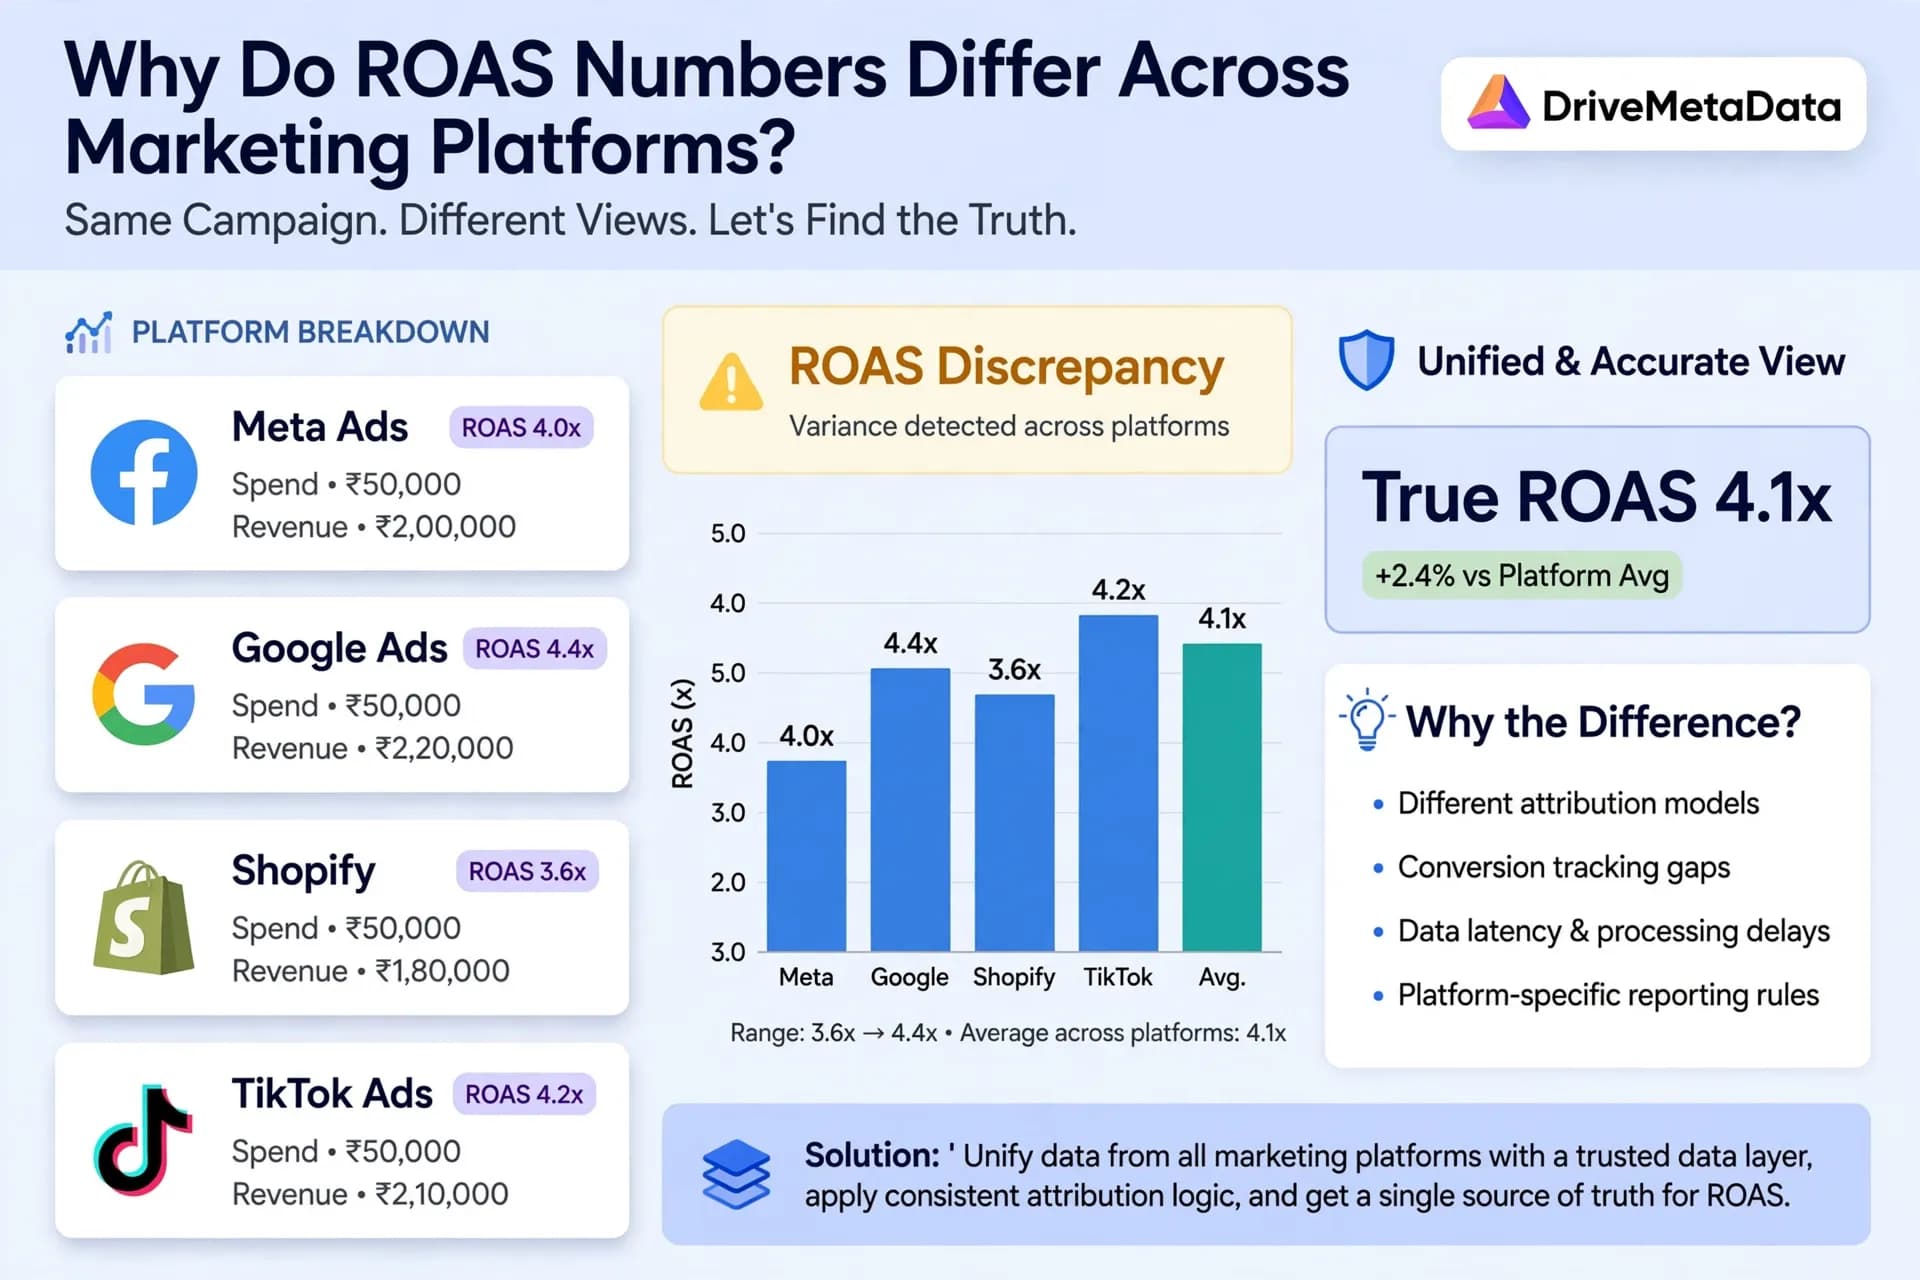
A practical reconciliation method for platform ROAS, business ROAS, and incremental ROAS.
Ranjeet Ranjan
AI Executive Brief
ROAS discrepancies across Meta, GA4, Shopify, CRM, and finance usually come from different revenue definitions, spend definitions, attribution windows, attribution models, identity rules, event quality, and reporting freshness. This rewritten article gives marketers a decision-grade reconciliation workflow, the TRUTH framework, scorecards, formulas, evidence notes, and four FAQ answers while preserving the existing Strapi component structure.
ROAS discrepancies happen because marketing platforms do not measure the same event, customer, revenue, spend, time window, or attribution question. Meta, GA4, Shopify, CRM, and finance can each be useful, but they should not be forced to match. Reconcile ROAS by documenting definitions, normalizing inputs, and choosing the metric that fits the budget decision.
What ROAS Really Measures
The same campaign can look profitable in Meta, weaker in GA4, different again in Shopify, and still unresolved in CRM or finance. That does not always mean tracking is broken. It usually means every system is answering a different measurement question with different data, timing, identity, and attribution rules.
ROAS means return on ad spend. In its simplest form:
ROAS = attributed revenue / advertising spend
A ROAS number is not automatically wrong because it differs by platform. It is incomplete until the team knows the revenue basis, spend basis, attribution model, attribution window, identity logic, conversion definition, and reporting freshness behind it.
Why ROAS Discrepancies Create Budget Risk
The useful question is not "Which platform has the highest ROAS?" The useful question is "Which ROAS number is fit for this decision?" Platform dashboards are useful for optimization, but they should not be treated as finance-verified revenue, profit, or causal proof without reconciliation.
Separate the metric family before moving budget:
- Platform ROAS = platform-attributed conversion value / platform media spend
- Business ROAS = reconciled revenue / agreed marketing cost
- Blended ROAS or MER = total revenue / total marketing spend
- Contribution-margin ROAS = contribution margin from attributed or reconciled orders / marketing spend
- Incremental ROAS = incremental revenue caused by marketing / incremental media spend
Evidence Snapshot For ROAS Reconciliation
Google Analytics Attribution Reporting
Google Analytics attribution documentation should be used to verify how GA4 assigns credit to touchpoints in attribution reporting. The important editorial point is that GA4 reporting is a measurement environment with its own model, available events, reporting identity, and configured attribution settings. It should be reconciled before it is used as the business truth for a budget decision.
Google Ads Attribution Models
Google Ads attribution documentation explains attribution models as rules for assigning conversion credit across ad interactions. That supports a cautious claim: Google Ads ROAS can reflect platform conversion-credit rules and optimization settings. It does not prove that a Google Ads number is the same as finance-adjusted revenue or incremental revenue.
Invalid Traffic Controls
Google Ads invalid-traffic guidance supports the need to treat traffic quality as part of ROAS trust. Invalid clicks, impressions, duplicate events, and low-quality interactions can make spend and conversion reporting harder to compare. Use official platform guidance as source context, not as a fraud benchmark for a specific advertiser.
Shopify Marketing Reports
Shopify marketing-report documentation should be used to verify how Shopify groups marketing activity, campaign data, sessions, sales, and orders. Commerce reporting can answer a different question than ad-platform reporting because Shopify starts from store and order context. The final claim should stay practical: compare the commerce view with ad-platform and analytics views before moving budget.
Why ROAS Differs Across Meta, GA4, Shopify, CRM, And Finance
Attribution Model
ROAS differs because platforms are built for different jobs. An ad platform is designed to optimize ad delivery inside its environment. GA4 is designed to analyze website and app behavior. Shopify records commerce activity. A CRM may include leads, sales stages, repeat purchases, offline revenue, and customer status. Finance may reconcile net revenue, refunds, taxes, discounts, chargebacks, and margin. Attribution models decide which touchpoints receive credit. A last-click model, a data-driven model, a first-party CRM model, and an experiment-based model can all assign different credit to the same purchase. Neither number should be accepted blindly. Each number should be labeled by model and use case.
Attribution Window
An attribution window controls how long after an ad click, view, session, or other interaction a conversion can still be credited. Longer windows can include more delayed conversions. Shorter windows can exclude delayed demand. A weekly promotion, replenishment purchase, subscription sale, and enterprise lead cycle rarely deserve the same window.
Identity And Event Collection
Platforms identify customers differently. A browser cookie, mobile device signal, logged-in user, email hash, CRM contact, Shopify customer record, order ID, and finance account can represent the same person with different confidence. This is where identity resolution becomes a measurement control, not only a data-engineering feature.
Revenue Definition
Revenue may mean gross sales, net sales, paid orders, fulfilled orders, first-order revenue, repeat revenue, subscription revenue, revenue after refunds, or contribution margin. ROAS will change if one system counts gross purchase value and another removes discounts, refunds, cancelled orders, taxes, or shipping.
Spend Definition
The denominator also changes. An ad platform usually shows media spend inside that platform. A business-level view may include agency fees, creative production, affiliate payouts, influencer fees, tooling, discounts, and other variable marketing costs. If an illustrative campaign has 100,000 in attributed revenue and 20,000 in media spend, platform ROAS is 5.0x. If the business includes another 10,000 in related marketing cost, business ROAS becomes 3.33x. The gap is a spend-definition difference, not automatically a tracking bug.
Conversion Definition
A conversion can mean a purchase event, an order, a qualified lead, an opportunity, a retained customer, or a finance-recognized sale. Comparing ROAS across systems is weak when one platform counts purchase events, another counts online orders, and the CRM waits for qualified pipeline or closed revenue.
Latency, Refunds, And Finalization
Some numbers update quickly. Others change after order processing, returns, offline sales, CRM stage movement, finance close, or attribution reprocessing. Same-day ROAS can be useful for monitoring, but large allocation decisions should wait until each source reaches the right freshness standard for the decision.
Invalid Traffic And Duplicate Events
Invalid traffic, duplicate purchase events, repeated conversion tags, and mismatched event IDs can distort ROAS. A practical reconciliation process should inspect event quality, not only attribution logic. If the issue is duplicate revenue, review the tracking layer and duplicate revenue events before changing budget.
Platform ROAS vs Business ROAS
Platform ROAS is useful for platform optimization. Business ROAS is useful for budget governance. Incremental ROAS is useful for causal questions. Use platform ROAS to optimize inside a platform. Use business ROAS for cross-channel budget discussions. Use incremental ROAS when the decision depends on whether marketing caused additional revenue. Mixing those three jobs creates false confidence.
The TRUTH ROAS Reconciliation Framework
Terms Of Decision
Use the TRUTH framework when ROAS numbers disagree and the team needs a budget decision:
| Letter | Check | What to document |
|---|---|---|
| T | Terms of decision | Is the decision about in-platform optimization, cross-channel allocation, finance reporting, or incrementality? |
| R | Revenue basis | Gross revenue, net revenue, first-order revenue, repeat revenue, refunds, cancellations, taxes, shipping, margin, and offline revenue treatment. |
| U | User identity and events | Customer ID, device ID, email, order ID, event ID, deduplication rules, server-side events, CRM joins, and event completeness. |
| T | Time window and attribution model | Lookback window, reporting lag, conversion date vs interaction date, model used, eligible touchpoints, and finalization timing. |
| H | Holdout and health checks | Invalid traffic, duplicate events, match rate, reconciliation variance, control group, geo test, or another incrementality method where needed. |
Start with the decision. If the paid media team is adjusting bids, platform ROAS may be enough. If leadership is reallocating budget across channels, platform ROAS should be reconciled against business revenue and total marketing cost. If the question is whether spend caused incremental revenue, attribution should be paired with a test, holdout, or credible causal method.
Revenue Basis
Revenue basis is the fastest way to explain many ROAS gaps. Ask whether each system uses gross revenue, net revenue, paid orders, fulfilled orders, first-order revenue, repeat revenue, subscription revenue, refunds, cancellations, taxes, shipping, discounts, margin, or offline revenue. If finance does not recognize the revenue basis, label the number as platform or analytics reporting instead of business ROAS.
User Identity And Events
Document the customer, event, and order identifiers that connect each system. Confirm whether client-side and server-side events are deduplicated, whether order IDs are stable, whether CRM contacts map to ecommerce customers, and whether match-rate changes are visible in reporting. Unknown identity rules should trigger an audit, not a budget shift.
Time Window And Attribution Model
Document the lookback window, conversion date rules, interaction date rules, attribution model, eligible channels, and reporting lag. Attribution windows define conversion eligibility. Attribution models define credit distribution. A ROAS comparison is weak when platforms use different windows, different models, or both.
Holdout And Health Checks
For large budget decisions, add health checks beyond attribution. Review invalid traffic, duplicate events, missing events, suspicious click or impression patterns, source-system reconciliation variance, and whether a holdout, geo test, lift test, MMM, or another causal method is needed. Health checks prevent teams from optimizing a broken measurement layer.
How To Run TRUTH
Run TRUTH in one shared worksheet with marketing, analytics, and finance. Do not average conflicting ROAS numbers. Label each number by decision type, source system, revenue basis, spend basis, model, window, identity logic, freshness, and caveat. A ROAS number passes the framework when the team can explain what it measures and what decision it can safely support.
ROAS Reconciliation Scorecard
Decision Type
Use this scorecard before moving budget because of a ROAS mismatch:
| Check | What to compare | Owner | Action trigger |
|---|---|---|---|
| Decision type | Optimization, allocation, finance reporting, or incrementality | Growth lead | Pick the metric family before debating values. |
| Revenue basis | Gross, net, adjusted, first-order, repeat, offline, margin | Finance plus analytics | Reconcile revenue before presenting board-level ROAS. |
| Spend basis | Media spend only vs total marketing cost | Finance plus paid media | Label platform ROAS when non-media costs are excluded. |
| Conversion definition | Purchase, order, qualified lead, opportunity, retained customer | Analytics owner | Pause comparison when systems count different conversions. |
Revenue, Spend, And Conversion Checks
Revenue, spend, and conversion checks stop the team from comparing unlike numbers. A campaign can look strong on gross attributed revenue and weaker after contribution margin. It can look efficient when platform spend excludes fees, creative, affiliate payouts, or discounts. It can also appear to scale acquisition while mostly receiving credit for returning customers.
Identity, Event, And Finalization Checks
Identity, event, and finalization checks identify whether the reporting layer is mature enough for the decision. Compare user ID, device ID, email, order ID, event ID, CRM contact, duplicate conversion rate, refund timing, return windows, and finance-close timing. For large allocation changes, pair attribution, MMM, and incrementality rather than treating attributed ROAS as causal proof.
Metrics And Formulas For Decision-Grade ROAS
Key Metrics Beyond Platform ROAS
The goal is not to create more metrics. The goal is to map each metric to the decision it can safely support:
| Metric | Formula / how to calculate | Source type | What it proves | Caveat | Action trigger |
|---|---|---|---|---|---|
| Platform ROAS | Platform-attributed conversion value / platform media spend | Ad platform | How the platform credits campaigns under its rules | Not finance truth or causal proof | Use for bid, creative, and audience optimization. |
| Business ROAS | Reconciled revenue / agreed marketing cost | Finance, warehouse, CRM, commerce | Whether spend supports the agreed business view | Depends on attribution or allocation method | Use for budget governance. |
| Blended ROAS or MER | Total revenue / total marketing spend | Finance, ecommerce, analytics | Whether total marketing efficiency is improving | Does not isolate channel contribution | Use with channel diagnostics. |
| Incremental ROAS | Incremental revenue caused by marketing / incremental spend | Holdout, geo test, lift test, MMM | Whether spend likely caused additional revenue | Requires sound design and enough signal | Use before large budget moves. |
When To Use Each Metric
Useful metrics beyond platform ROAS include contribution-margin ROAS, new-customer ROAS, payback period, revenue reconciliation rate, duplicate conversion rate, and attribution variance. For large allocation decisions, pair marketing attribution software with a finance-approved reconciliation process.
Use platform ROAS for in-platform bid, audience, and creative decisions. Use business ROAS when leadership asks whether marketing spend supports the company's revenue view. Use incremental ROAS when the decision depends on whether spend caused additional demand. Use MER or blended ROAS as a health metric, not as a replacement for channel diagnostics.
Illustrative Scenario And Common ROAS Mistakes
The Paid Social ROAS Dispute
This scenario is illustrative, not a customer result. A D2C growth team reviews a paid social campaign. The ad platform reports 5.8x ROAS. GA4 reports 3.6x. Shopify shows 4.1x for marketing-attributed sales. The CRM and finance export shows 3.0x after returns, discounts, and repeat-customer exclusions.
Mistake 1: Choosing The Highest ROAS
The first mistake is choosing the highest ROAS because it is easiest to defend. A high platform ROAS may include a broader attribution window, repeated purchases, existing customer demand, duplicated events, or credit for customers who would have bought anyway. For ecommerce teams, Shopify marketing attribution should be reconciled against ad-platform and finance views before budget is moved.
Mistake 2: Treating Attribution As Causal Proof
The second mistake is treating attributed ROAS as incremental ROAS. Attributed ROAS assigns credit. Incremental ROAS estimates additional revenue caused by spend. The team should label platform ROAS for in-platform optimization, finance-adjusted business ROAS for budget review, new-customer ROAS for acquisition quality, and incremental ROAS only when a holdout or credible test supports a causal read.
How DriveMetaData Supports ROAS Reconciliation
DriveMetaData is designed to help marketing, analytics, and finance teams connect customer identity, campaign events, commerce data, CRM data, fraud signals, and revenue records into a clearer measurement layer. The useful role is practical: unify IDs where possible, surface event-quality issues, connect source-system metadata, preserve attribution logic, and help teams explain why ROAS differs before budget changes are made.
FAQ
Why do Meta, GA4, Shopify, and CRM ROAS numbers disagree?
They disagree because each system can use different attribution models, attribution windows, event definitions, identity rules, revenue sources, spend definitions, and reporting freshness. A mismatch does not automatically mean tracking is broken. It means the team needs to document what each number measures before using it for budget decisions.
Which ROAS should guide budget decisions?
Use the ROAS that matches the decision. Platform ROAS can guide in-platform optimization. Business ROAS should guide cross-channel budget and finance reporting when revenue and spend definitions are reconciled. Incremental ROAS should guide high-stakes decisions about whether spend caused additional revenue. Reconcile before major budget reviews, after tracking changes, after major campaign launches, and during normal finance reporting cycles.
Is platform ROAS wrong?
Platform ROAS is not inherently wrong. It is platform-scoped. It reflects the platform's available signals, attribution rules, conversion settings, and reporting environment. The mistake is using platform ROAS as if it were finance-adjusted profit or causal lift without reconciliation.
How is incremental ROAS different from attributed ROAS?
Attributed ROAS assigns conversion credit to marketing touchpoints. Incremental ROAS estimates the additional revenue caused by marketing spend. Incrementality usually requires a holdout, geo test, lift test, MMM, or another credible causal method. Attribution can guide diagnostics, but it should not be treated as causal proof by default.
DriveMetaData helps marketing, analytics, and finance teams compare platform-reported ROAS with business-level reporting by connecting customer identity, campaign events, commerce data, CRM records, fraud signals, and revenue context. Use the reconciled view to explain differences before changing budgets, not to claim that one platform number is automatically final.
Attribution Audit
Find the gaps hiding in your attribution data.
Get a focused audit of campaign tracking, ROAS signals, and conversion paths before media spend leaks into blind spots.
Related Blogs
More from our insights
Shopify Marketing Attribution Across Meta, Google Ads, and Email: A Revenue Truth Framework
Customer Data Platform · 11 min read
Shopify Customer Journey Attribution: Multi-Touch Models & Repeat Order Tracking
Customer Data Platform · 6 min read
Marketing Efficiency Ratio (MER) Needs A Warning Label For D2C Growth
Customer Data Platform · 8 min read